ABSTRACT:
Determination of Nitrate Nitrogen, Urea –Nitrogen and Ammoniacal Nitrogen in fertilizer samples by IR spectroscopy. The main forms of Nitrogen in fertilizer are Ammoniacal Nitrogen, Urea Nitrogen and Nitrate Nitrogen. In this study, FTIR –ATR spectra of Nitrate, Urea and Ammoniacal Nitrogen standard solution with low to high concentration were prepared by using Potassium Bromide (KBr). The result showed that the wavenumber of Nitrate –Nitrogen (at a region 824 cm-1) Urea- Nitrogen (at a region1674 cm-1 for C=O bond, 1590 cm-1 for N-H bond, 1459 cm-1 for C=N bond). Ammoniacal Nitrogen (at a region 1362 cm-1) in different fertilizer samples.
KEYWORDS: Fertilizer, Nitrate-Nitrogen, Urea-Nitrogen, Ammoniacal-Nitrogen, Fourier Transform Infrared Spectroscopy, Attenuated Total Reflectance, Potassium –Bromide.
INTRODUCTION:
Effect of nitrogen fertilizer on plant growth:
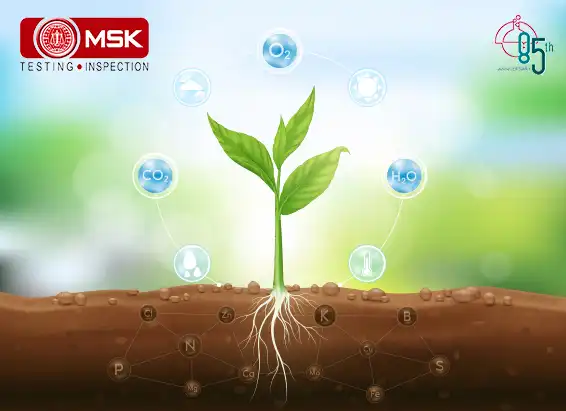
Nitrogen is an essential element for plant growth and development. It is a major component of amino acid, the building blocks of protein. Without proteins, plants wither and die. Nitrogen is a part of the chlorophyll molecule which is involved in creating food for plant through photosynthesis. Lack of nitrogen shows chlorosis (yellowish colour) of the plants. Due to environmental pollution, high nitrate concentration accumulates in the edible parts of leafy vegetables, particularly if excess nitrogen fertilizer has been applied. Consuming these crops can harm human health, these developing a suitable strategy for the agriculture application of nitrogen fertilizer is important. Although inorganic nitrogen compounds (i.e. NH4+, NO3-, NO2-) account for less than 5% of the total nitrogen in the soil, they are the main form of the element absorbed by the most plants. Urea is a source of nitrogen, an essential nutrient crucial for crop growth and development. Urea is the most important nitrogenous fertilizer because of its high Nitrogen Content. Inorganic and organic fertilizer are applied to maintain the nutrient condition of different cropping system.
2.1 Classical method for estimation of Urea - Nitrogen:
Kjeldahl Method: The kjeldahl method consists in a procedure of catalytically supported mineralization of organic material in a boiling mixture of sulphuric acid and sulphate salt at digestion temperature at 420 ° C. During the process the organically bonded nitrogen is converted into ammonium sulphate. Alkalizing the digested solution liberates ammonia which is quantitatively steam distilled and determined by titration.
Materials: The test reagents were Sulphuric acid, Copper sulphate, Potassium sulphate, Boric acid, Sodium hydroxide.
Time required: Minimum 3-4 hrs.
Structure:

2.2 Classical method for estimation of Nitrate - Nitrogen:
Cadmium Reduction Method: The nitrate is reduced to Nitrite in presence of cadmium granules. The nitrite produced is determined by diazotizing with sulphanilamide and coupling with N-(1-napthyl) ethlenediamine to form a highly coloured azo dye which is measured colorimetrically at 543nm.
Materials: The test reagents were Sulphanilamide, NEDA, EDTA, Cd granules, Copper Sulphate.
Time required: Minimum 3-4 hrs.
Structure:

2.3 Classical method for estimation of Ammoniacal - Nitrogen:
Phenate Method: An intensely blue coloured compound, indophenol by the reaction of ammonia, hypochlorite and phenol catalysed by sodium nitroprusside at a wavelength of 640 nm.
Materials: The test reagents were Ammonia, Phenol, Sodium Nitroprusside, Sodium hypochlorite
Time required: Minimum 3-4 hrs.
Structure:

3.0 Limitation of classical method:
Proposed method (FTIR method)
4.0 ADVANTAGE OF THE PROPOSED METHOD:
5.0 FTIR instrument
Fourier Transformed Infrared Spectroscopy (Thermo Scientific; Model no: Nicolet iS10), Equipped with an Attenuated Total Reflectance (ATR), and Transmittance having OMNIC software was used for analysis and data processing.
Attenuated Total Reflectance (ATR):


Transmittance:

5.1 Principle of FTIR:
Fourier-transform infrared spectroscopy (FTIR) is a technique used to obtain an infrared spectrum of absorption and reflectance of a solid or liquid.
An FTIR spectrometer simultaneously collects high-spectral-resolution data over a wide spectral range. In this study, –CONH2 bond, -NO3 bond and N-H bond present in fertilizer were evaluated by IR spectrometry.

Wavenumber selected for urea(-CONH2):
-CONH2 for Urea at a region 1674 cm-1 for C=O, 1590 cm-1 for N-H, 1459 cm-1 for C=N (showing stretching frequency of the bond) were evaluated and quantified.
Wavenumber selected for nitrate(-NO3): 
-N –H for Ammoniacal Nitrogen at a region 1362 cm-1 (showing stretching frequency of the bond) was evaluated and quantified.
Wavenumber selected for ammoniacal nitrogen (N-H):
- NO3- for Nitrate–Nitrogen at 824 cm-1 was evaluated and quantified. (Bending frequency of the bond).

5.2 BRIFE DESCRIPTION OF FTIR METHOD:
PREPARATION OF STANDARD CURVE:
The Urea, Potassium Nitrate and Ammonium chloride standard (Analytical Grade with 99.5% purity) were used for preparation of standard curve by FTIR. The standards were dried at 105 deg C for 1 hr. for removal of inherent moisture.
UREA STANDARD:
The Urea Standard as such 50%, 30 % and 10% diluted with KBr and made homogeneous by mixing thoroughly with mortar and pestle.
Potassium nitrate:
The Potassium Nitrate Standard as such 40%, 20 % and 10% diluted with KBr and made homogeneous by mixing thoroughly with mortar and pestle.
Ammonium chloride:
The Ammonium Chloride Standard as such 20%, 10 % and 5% diluted with KBr and made homogeneous by mixing thoroughly with mortar and pestle.
5.3 Preparation of standard curve:
Separate standard curve was prepared for quantifying Urea-Nitrogen, Nitrate-Nitrogen and Ammoniacal Nitrogen content of fertilizer samples.

ESTIMATION OF UREA NITROGEN CONTENT OF FRETILIZER SAMPLEs:


| Sample name | Urea Nitrogen Content | ||
| Analysed by Classical method (%) | Analysed by FTIR (Considering CONH2 group) (%) | Declared value in samples (%) | |
| Fertilizer sample 1 | 16.6 | 16.7 | 16.6 |
| Fertilizer sample 2 | 16.7 | 16.9 | 16.6 |
ESTIMATION OF nitrate- NITROGEN CONTENT OF FRETILIZER SAMPLES:


| Sample name | Nitrate- Nitrogen Content | ||
| Analysed by Classical method (%) | Analysed by FTIR (Considering NO3 group) (%) | Declared value in samples (%) | |
| Fertilizer sample 1 | 7.94 | 7.90 | 7.70 |
| Fertilizer sample 2 | 7.86 | 7.82 | 7.70 |
ESTIMATION OF ammoniacal- NITROGEN CONTENT OF FRETILIZER SAMPLES


| Sample name | Ammonical- Nitrogen Content | ||
| Analysed by Classical method (%) | Analysed by FTIR (Considering NH3-N group) (%) | Declared value in samples (%) | |
| Fertilizer sample 1 | 7.67 | 7.74 | 7.70 |
| Fertilizer sample 2 | 7.82 | 7.78 | 7.70 |
CONCLUTION :
Contributed by : Atrayee Saha & Tapashri Bagch


Chief Operation, FAMD, Tata Steel Limited..


Sr. General Manager,, Emirates Trading Agency L.L.C..


Mines Manager, Hindustan Zinc Limited, a Vedanta Company.


General Manager, Stevin Rock L.L.C..


Executive Vice President (Works),, DCW Limited.


AVP – Coal Quality & Sales Compliance Head,, PT Indo Tambangraya Megah Tbk (BANPU).


Laboratory Head, MMX.


Shipping Administrator, Mount Gibson Iron Limited.


Senior Director – Asia Pacific Iron Ore Sales,, Cliffs Natural Resources Pty Ltd..


Member, Compass Group (India) Pvt. Ltd.

Posted on January 16 2026 By Mitra S.K ADMIN
Read More
Posted on January 16 2026 By Mitra S.K ADMIN

Posted on January 16 2026 By Mitra S.K ADMIN

Posted on January 16 2026 By Mitra S.K ADMIN

Posted on January 16 2026 By Mitra S.K ADMIN
Posted on December 16 2025 By Mitra S.K ADMIN
Posted on December 16 2025 By Mitra S.K ADMIN
Posted on December 16 2025 By Mitra S.K ADMIN

Posted on December 11 2025 By Mitra S.K ADMIN
![Estimating Cobalt by UV-Vis Spectroscopy: The [CoCl?]²? Acetone Method](https://mitrask.com/uploads/blogs/1764834098Estimating%20Cobalt.png)
Posted on December 04 2025 By Mitra S.K ADMIN
Posted on December 04 2025 By Mitra S.K ADMIN
Posted on November 12 2025 By Mitra S.K ADMIN

Posted on September 23 2025 By Mitra S.K ADMIN

Posted on August 01 2025 By Mitra S.K ADMIN

Posted on July 25 2025 By Mitra S.K ADMIN

Posted on July 18 2025 By Mitra S.K ADMIN

Posted on July 01 2025 By Mitra S.K ADMIN

Posted on May 22 2025 By Mitra S.K ADMIN

Posted on January 24 2025 By Mitra S.K ADMIN

Posted on January 24 2025 By Mitra S.K ADMIN
Posted on December 31 2024 By Mitra S.K ADMIN
Posted on December 31 2024 By Mitra S.K ADMIN
Posted on December 31 2024 By Mitra S.K ADMIN
Posted on December 31 2024 By Mitra S.K ADMIN
Posted on December 31 2024 By Mitra S.K ADMIN
Posted on December 03 2024 By Mitra S.K ADMIN

Posted on October 17 2024 By Mitra S.K ADMIN

Posted on October 04 2024 By Mitra S.K ADMIN

Posted on September 13 2024 By Mitra S.K ADMIN

Posted on August 27 2024 By Mitra S.K ADMIN

Posted on August 23 2024 By Mitra S.K ADMIN

Posted on June 27 2024 By Mitra S.K ADMIN
Posted on June 22 2024 By Mitra S.K ADMIN
Posted on June 15 2024 By Mitra S.K ADMIN

Posted on May 24 2024 By Mitra S.K ADMIN

Posted on May 17 2024 By Mitra S.K ADMIN

Posted on May 09 2024 By Mitra S.K ADMIN

Posted on April 20 2024 By Mitra S.K ADMIN
Posted on April 13 2024 By Mitra S.K ADMIN

Posted on April 30 2024 By Mitra S.K ADMIN

Posted on April 29 2024 By Mitra S.K ADMIN
Posted on December 30 2023 By Mitra S.K ADMIN
Posted on December 30 2023 By Mitra S.K ADMIN
Posted on December 30 2023 By Mitra S.K ADMIN
Posted on December 27 2023 By Mitra S.K ADMIN
Posted on December 27 2023 By Mitra S.K ADMIN
Posted on December 27 2023 By Mitra S.K ADMIN
Posted on December 27 2023 By Mitra S.K ADMIN
Posted on December 27 2023 By Mitra S.K ADMIN
Posted on December 27 2023 By Mitra S.K ADMIN
Posted on December 27 2023 By Mitra S.K ADMIN
Posted on December 26 2023 By Mitra S.K ADMIN
Posted on April 05 2022 By Mitra S.K ADMIN
Posted on April 06 2022 By Mitra S.K ADMIN
Posted on April 06 2022 By Mitra S.K ADMIN
Posted on April 06 2022 By Mitra S.K ADMIN
Posted on April 06 2022 By Mitra S.K ADMIN
Posted on April 06 2022 By Mitra S.K ADMIN
Posted on April 06 2022 By Mitra S.K ADMIN
Posted on April 06 2022 By Mitra S.K ADMIN
Posted on April 06 2022 By Mitra S.K ADMIN
Posted on April 06 2022 By Mitra S.K ADMIN
Posted on April 06 2022 By Mitra S.K ADMIN
Posted on April 06 2022 By Mitra S.K ADMIN
Posted on April 06 2022 By Mitra S.K ADMIN
Posted on November 28 2022 By Mitra S.K ADMIN

Posted on April 06 2022 By Mitra S.K ADMIN
Posted on April 06 2022 By Mitra S.K ADMIN
Posted on April 06 2022 By Mitra S.K ADMIN
Posted on November 28 2022 By Mitra S.K ADMIN
Posted on June 14 2022 By Mitra S.K ADMIN
