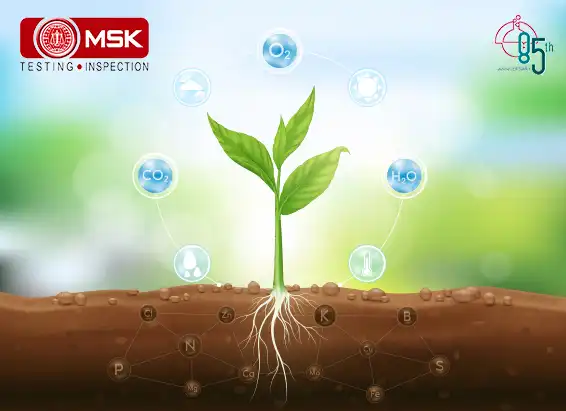
Introduction:
The bursting of crackers during in any occasion increases the concentration of dust and pollutants. The fine dust that settles after bursting crackers is rich in pollutants like oxides of Sulphur and nitrogen, metal dust and organic pollutants.
Even the tiny sparklers, torches and flower pots which are otherwise considered to create no noise at all but can generate thick smoke that can affect the respiratory tract of human. The suspended particulate matter (SPM) levels rise significantly during Diwali. This causes throat, nose and eye related problems which can later develop into adverse health issues. Fire crackers have much more severe effects in people with heart, respiratory or nervous system disorders. They can also cause water contamination and acid rains. The green light produced in fireworks displays comes from barium, which is radioactive and poisonous. The blue colour produced from copper causes irritation in the respiratory tract. Poly Aromatic Hydrocarbons (PAH) are also very well-known air pollutant which are carcinogenic in nature.
In this study we have investigated the variations of suspended particulate matter, concentration of different environmental contaminant due to the burning of firecrackers during festival, occasion or any other event e.g. New year festival celebrations etc. A 3hours long intensive measurements of Particulate Matter and were captured after creating a massive firework.
Material & Methods
Equipment used
ICP OES
GC-MS/MS
UV -VIS Spectrophotometer
RDS
FDS
Digital balance (1mg)
Ultrasonic bath
Assorted Glassware
Chemical/ Consumable Used:
Methods
Sampling
All types of fire crackers were burnt for almost 1 hr. One RDS and one FDS machine were located at a distance of 3-4 foot from the burning location.
The dust and smoke emitted from the crackers are trapped by these RDS and FDS. The Average flow was 1.1 min/m3 for RDS and 16.7 LPM for FDS. The samplers inlet height was maintained 3 meter from ground level. TCM, sodium arsenite and sulfuric acid are taken in different impinger to absorb SO2, NO2 and NH3 respectively. The impingers are placed in cold box and these were connected to through manifold of RDS.
Particulate matters:
Initial weight of the filter paper before sampling was taken. After sampling filter papers are conditioned at room temp which was maintained within 20-30° C and 40-50% relative humidity in an airtight desiccator for 24 hours. After this conditioning, final weight of the filter paper was measured.
This procedure is followed for both PM10 and PM 2.5
SO2
10mL of collected sample was taken into a 25 ml impinger. To it added 1 ml 0.6% sulphamic acid and allowed to reacting for 10 minutes. Then to it added 2 ml of 0.2% formaldehyde solution and 2 ml pararosaniline solution . After that volume was made up to 25 ml with distilled water . A blank sample was prepared in the same manner using unexposed absorbing reagent. After a 30 mins colour development interval and but before 60 mins, the absorbance of samples and reagent blank was measured in UV-VIS spectra at 560 nm.
NOx
Pipetted out 10 ml of the collected sample into a 50 ml volumetric flask. To it added 1 ml of hydrogen peroxide solution, 10 ml of sulphanilamide solution, and 1.4 ml of NEDA solution, with thorough mixing after the addition of each reagent and the volume made up to 50 ml using distilled water. A blank sample was prepared in the same manner using unexposed absorbing reagent. After a 10 mins of colour development interval, the absorbance of samples and reagent blank at 540 nm was recorded from UV-VIS spectra at 540 nm.
NH3
10 ml. of sample solution was pipetted out into a 25 ml. volumetric flask. All solutions and sample was maintained at 25o C. To it added 2ml buffer, 5 ml. of the working phenol solution, then it was mixed and filled to about 22 ml. with distilled water. Then to it added 2.5 ml. of the working hypochlorite solution and rapidly mixed. The sample is then stored in the dark at 25 ℃ for 30 mins to develop colour. The absorbance of the solution was then measured at 630 nm using 1 cm path length cells.
Heavy Metals
One portion of the particulate matter which was deposited on the EPM filter paper was used for Heavy metal analysis. One portion of filter paper was digested with Nitric acid. After filtration, it was subjected to ICP- OES analysis. ICP-OES was calibrated with the standard and result was computed by software.
PAH
Another portion of the filter paper (PM10) was subjected to a extraction procedure by putting the filter paper in toluene an sonicated for 30mins. The toluene portion is then filtered though 0.45 micron filter paper and injected to GC-MS/MS.
Result and discussion:
The Results of Particulate Matter (PM2.5, PM10), PAH, Metals, gaseous contaminants during the study period are shown in Table 1 & Table 2
Table -1.0
| Particulate phase | Gaseous Phase | ||||
| Sl No | Parameter | Result (mg/m3) | Sl No | Parameter | Result (mg/m3) |
| 1 | PM10 | 847 | 1 | SO2 | 52.2 |
| 2 | PM2.5 | 605 | 2 | NOx | 91.5 |
| 3 | NH3 | 23 | |||
Table-2.0
| Particulate phase - Heavy Metals | Particulate phase -Poly Aromatic Hydrocarbon | ||||
| Sl No | Parameter | Result (mg/m3) | Sl No | Parameter | Result (ng/m3) |
| 1 | Al | 46 | 1 | Naphthalene | <0.5 |
| 2 | Ba | 84 | 2 | Acenaphthylene | <0.5 |
| 3 | Fe | 1.56 | 3 | Acenaphthene | <0.5 |
| 4 | Pb | 0.08 | 4 | Fluorene | <0.5 |
| 5 | Ni | <5.0 | 5 | Anthracene | 3.5 |
| 6 | As | <1.0 | 6 | Phenanthrene | 1.0 |
| 7 | Fluoranthene | 25.3 | |||
| 8 | Pyrene | 13.6 | |||
| 9 | Benz[a]Anthracene | 28.8 | |||
| 10 | Chrysene | 43.9 | |||
| 11 | Benzo(k)Fluoranthene | 70.7 | |||
| 12 | Benzo(a)Pyrene | 21.2 | |||
| 13 | Benzo[ghi]Perylene | 30.3 | |||
| 14 | Dibenz(ah)Anthracene | 25.3 | |||
| 15 | Indeno(1,2,3-cd)Pyrene | 8.6 | |||
| 16 | Benzo(b)Fluoranthene | 17.2 | |||
The data analysis indicates that a very high amount of Particulate matter deposited (both PM10 and PM2.5) which may create adverse effect on respiratory system not only that SO2, NO2, NH3 is also found very high in concentration. Al, Ba, Fe present in the particulate phase but lead nickel and arsenic was not present. The alarming result also observed for PAH concentration. The total concentration of PAH was 289.4 ng/m3 which is substantially high. Among the PAH Benzo(k)Fluoranthene was highest in conc (70.7 ng/m3). Benzo(a)Pyrene - a very important parameter as per CPCB guideline was also present in sample with a value of 21.2ng/m3.
Conclusion:
Fireworks cause extensive air pollution in a short amount of time, leaving metal particles, dangerous toxins, harmful chemicals and smoke in the air for hours and days. Some of the toxins never fully decompose or disintegrate, but rather hang around in the environment, poisoning all they come into contact with. Exposure to fine particles, like those found in smoke and haze, is linked to negative health implications.
Contributed by : Soumyodeep Mukhopadhaya and Pradip Bag .


Chief Operation, FAMD, Tata Steel Limited..


Sr. General Manager,, Emirates Trading Agency L.L.C..


Mines Manager, Hindustan Zinc Limited, a Vedanta Company.


General Manager, Stevin Rock L.L.C..


Executive Vice President (Works),, DCW Limited.


AVP – Coal Quality & Sales Compliance Head,, PT Indo Tambangraya Megah Tbk (BANPU).


Laboratory Head, MMX.


Shipping Administrator, Mount Gibson Iron Limited.


Senior Director – Asia Pacific Iron Ore Sales,, Cliffs Natural Resources Pty Ltd..


Member, Compass Group (India) Pvt. Ltd.

Posted on January 16 2026 By Mitra S.K ADMIN
Read More
Posted on January 16 2026 By Mitra S.K ADMIN

Posted on January 16 2026 By Mitra S.K ADMIN

Posted on January 16 2026 By Mitra S.K ADMIN

Posted on January 16 2026 By Mitra S.K ADMIN
Posted on December 16 2025 By Mitra S.K ADMIN
Posted on December 16 2025 By Mitra S.K ADMIN
Posted on December 16 2025 By Mitra S.K ADMIN

Posted on December 11 2025 By Mitra S.K ADMIN
![Estimating Cobalt by UV-Vis Spectroscopy: The [CoCl?]²? Acetone Method](https://mitrask.com/uploads/blogs/1764834098Estimating%20Cobalt.png)
Posted on December 04 2025 By Mitra S.K ADMIN
Posted on December 04 2025 By Mitra S.K ADMIN

Posted on November 12 2025 By Mitra S.K ADMIN

Posted on September 23 2025 By Mitra S.K ADMIN

Posted on August 01 2025 By Mitra S.K ADMIN
Posted on July 25 2025 By Mitra S.K ADMIN

Posted on July 18 2025 By Mitra S.K ADMIN

Posted on July 01 2025 By Mitra S.K ADMIN

Posted on May 22 2025 By Mitra S.K ADMIN

Posted on January 24 2025 By Mitra S.K ADMIN

Posted on January 24 2025 By Mitra S.K ADMIN
Posted on December 31 2024 By Mitra S.K ADMIN
Posted on December 31 2024 By Mitra S.K ADMIN
Posted on December 31 2024 By Mitra S.K ADMIN
Posted on December 31 2024 By Mitra S.K ADMIN
Posted on December 31 2024 By Mitra S.K ADMIN
Posted on December 03 2024 By Mitra S.K ADMIN
Posted on October 17 2024 By Mitra S.K ADMIN

Posted on October 04 2024 By Mitra S.K ADMIN

Posted on September 13 2024 By Mitra S.K ADMIN

Posted on August 27 2024 By Mitra S.K ADMIN

Posted on August 23 2024 By Mitra S.K ADMIN
Posted on June 27 2024 By Mitra S.K ADMIN
Posted on June 22 2024 By Mitra S.K ADMIN
Posted on June 15 2024 By Mitra S.K ADMIN

Posted on May 24 2024 By Mitra S.K ADMIN
Posted on May 17 2024 By Mitra S.K ADMIN

Posted on May 09 2024 By Mitra S.K ADMIN
Posted on April 20 2024 By Mitra S.K ADMIN
Posted on April 13 2024 By Mitra S.K ADMIN

Posted on April 30 2024 By Mitra S.K ADMIN

Posted on April 29 2024 By Mitra S.K ADMIN
Posted on December 30 2023 By Mitra S.K ADMIN
Posted on December 30 2023 By Mitra S.K ADMIN
Posted on December 30 2023 By Mitra S.K ADMIN
Posted on December 27 2023 By Mitra S.K ADMIN
Posted on December 27 2023 By Mitra S.K ADMIN
Posted on December 27 2023 By Mitra S.K ADMIN
Posted on December 27 2023 By Mitra S.K ADMIN
Posted on December 27 2023 By Mitra S.K ADMIN
Posted on December 27 2023 By Mitra S.K ADMIN
Posted on December 27 2023 By Mitra S.K ADMIN
Posted on December 26 2023 By Mitra S.K ADMIN
Posted on April 05 2022 By Mitra S.K ADMIN
Posted on April 06 2022 By Mitra S.K ADMIN
Posted on April 06 2022 By Mitra S.K ADMIN
Posted on April 06 2022 By Mitra S.K ADMIN
Posted on April 06 2022 By Mitra S.K ADMIN
Posted on April 06 2022 By Mitra S.K ADMIN
Posted on April 06 2022 By Mitra S.K ADMIN
Posted on April 06 2022 By Mitra S.K ADMIN
Posted on April 06 2022 By Mitra S.K ADMIN
Posted on April 06 2022 By Mitra S.K ADMIN

Posted on April 06 2022 By Mitra S.K ADMIN
Posted on April 06 2022 By Mitra S.K ADMIN
Posted on April 06 2022 By Mitra S.K ADMIN
Posted on November 28 2022 By Mitra S.K ADMIN
Posted on April 06 2022 By Mitra S.K ADMIN
Posted on April 06 2022 By Mitra S.K ADMIN
Posted on April 06 2022 By Mitra S.K ADMIN
Posted on November 28 2022 By Mitra S.K ADMIN
Posted on June 14 2022 By Mitra S.K ADMIN

