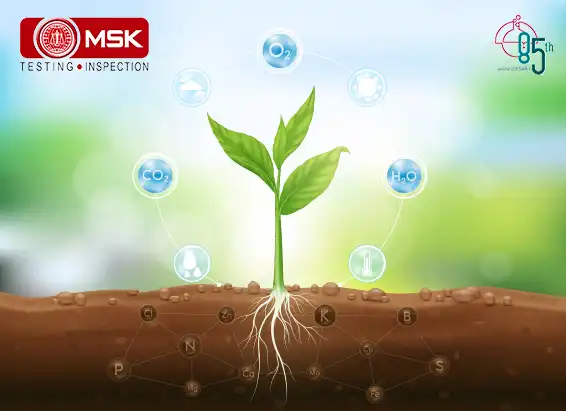
Abstract:
Anthocyanins are a type of pigment found in fruits that offer health benefit. It belongs to a class of compound called flavonoids that have antioxidant properties. The colour change from pink red to blue violet with change in pH values from 1.0 to 4.5 indicates the presence of anthocyanin. The total anthocyanin content was analyzed by the pH differential method by measuring the absorbance at pH 1.0 and pH 4.5 by UV-Vis spectrophotometer. Anthocyanin content was estimated in five popular fresh fruit samples, viz. apple, cherry, strawberry, blueberry and orange. The results of anthocyanin content were found to be 10 to 410.70 mg/100 g
Keyword:
Anthocyanin, fruits, Spectrophotometry, pH.
Introduction:
Anthocyanins are water-soluble pigments that based on the pH may impart blue, red or purple color. Examples of fruits rich in anthocyanins are blueberry, bilberry, red raspberry, red cabbage, cherry, eggplant peel and dark grapes. Anthocyanins are known to possess antioxidant activity and for the quantification, separation, identification and purification of anthocyanins, the pH differential method has been used to determine the anthocyanin content and the absorbance was measured using UV- spectrophotometer.
Anthocyanins can be used industrially as natural colors and can be used for a wide variety of foods, cosmetics and drugs. As a natural product, anthocyanins are good for health due to their antioxidant properties and may have a role in boosting the immune system. In addition, it has a role in disease prevention and maintaining health. It was found that the percentage of anthocyanins estimated varies in different plant species. This has an impact on the individual intake of anthocyanins which is influenced by climate, cultivation, cultural. Higher anthocyanin intake was associated with an ~8–10% reduction in hypertension risk .
Materials and Method:
Samples, chemicals and reagents:
5 different types of fruits like apple, cherry, strawberry, blueberry, orange were purchased from local market of Kolkata, west Bengal.
Potassium chloride, sodium acetate, ethanol, methanol, petroleum benzene and hydrochloric acid were procured from Merck, India as were of AR Grade.
Instrument /equipment:
Shimadzu UV1900 spectrophotometer, pH meter, sonicator, and analytical balance were used for this analysis.
Procedure:
Preparation of buffers:
pH1.0 buffer (0.025 M potassium chloride) was prepared by using an analytical balance to weigh 1.86g of KCl in a 1000mL beaker. After that, 980mL of distilled water was added and mixed. The pH was measured using the pH meter and adjusted to pH 1.0 using HCl. The solution was transferred to a 1000mL volumetric flask and the volume was made upto 1000 ml using distilled water.
pH 4.5 buffer (0.4M sodium acetate) was prepared by using an analytical balance to weigh 54.43g of CH3CO2Na·3H2O in a 1000mL beaker. After that, 980mL of distilled water was added and mixed. The pH was measured using the pH meter and adjusted to pH4.5 using HCl. The solution was transferred to a 1000mL volumetric flask and the volume was made upto 1000mL using distilled water.
Preparation of Sample:
Approximate 25 to 30 g fresh blended fruits were weighed and extracted with ethanol and 0.1M HCl mixtures (85:15) in (1:2) ratio between puree and solvent and mixed together for 1 hr by using magnetic stirrer. The mixture was filtered through vacuum filtration, collected supernatant solution. The extraction procedure has been done in triplicate.
Preparation of test solutions:
The dilutions were done by using the volumetric pipette to measure and add the test portion in a 50 ml volumetric flask. The dilution factor was measured by diluting the test portion of each fruit by using pH buffer until the absorbance of the spectrophotometer measured at 520 nm was within the linear range (0.2-1.4 AU). Using the calculated dilution factor, the first one with a pH1.0 buffer and the other test solution with pH4.5 buffer.
Spectrophotometric Determination:
The absorbance was measured within 20-50min of preparation for the 2 test solutions pH1.0 and 4.5 using a spectrophotometer at 520 nm. Absorbance was also measured at 700nm for the correction of haze. The diluted test solution that was found to be excessively turbid was filtered before measuring the absorbance using filter papers with<1.2mm pore size to ensure that anthocyanins were not be absorbed. The blank used was distilled water and the test solutions were read against it.
Calculations:
The anthocyanin pigment concentration (as cyanidin-3-glucoside equivalents) was calculated using the following equation:
Anthocyanin concentration : A x MW x DF x103 V
s x l x 26900
Where,
A= (A520nm-A700nm)pH1.0-(A520nm-A700nm)pH4.5
MW=449.2 gmoL G1 for cyanidin-3-glucoside
DF =Dilution factor
L = Path length (cm)
s = Sample weight in g
e =26,900molar extinction coefficient, in L/mol cm for cyanidin-3-glucoside
103 = Factor for conversion from g to mg
Results and Discussions:
The estimation of anthocyanin content was carried out in fresh fruits such as apple, cherry, strawberry, blueberry and oranges. The results were incorporated in Table 1.
Table 1: anthocyanin content of fresh fruits
| Types of Fruits | Anthocyanin content (mg/100g) |
| Apple | 23.5 |
| Cherry | 135.4 |
| Strawberry | 40.8 |
| Blueberry |
410.70
|
| Orange | 10 |
Conclusion:
Thus, the method is successfully adopted for estimation of anthocyanin contents of different fresh fruits samples it was been observed that blueberry has highest amount anthocyanin. The method was found to be rapid, accurate and cost effective, hence, may be adopted for routine analysis.
Contributed by : Payel De .


Chief Operation, FAMD, Tata Steel Limited..


Sr. General Manager,, Emirates Trading Agency L.L.C..


Mines Manager, Hindustan Zinc Limited, a Vedanta Company.


General Manager, Stevin Rock L.L.C..


Executive Vice President (Works),, DCW Limited.


AVP – Coal Quality & Sales Compliance Head,, PT Indo Tambangraya Megah Tbk (BANPU).


Laboratory Head, MMX.


Shipping Administrator, Mount Gibson Iron Limited.


Senior Director – Asia Pacific Iron Ore Sales,, Cliffs Natural Resources Pty Ltd..


Member, Compass Group (India) Pvt. Ltd.
![Estimating Cobalt by UV-Vis Spectroscopy: The [CoCl?]²? Acetone Method](https://mitrask.com/uploads/blogs/1764834098Estimating%20Cobalt.png)
Posted on December 04 2025 By Mitra S.K ADMIN
Read MorePosted on December 04 2025 By Mitra S.K ADMIN
Posted on November 12 2025 By Mitra S.K ADMIN

Posted on September 23 2025 By Mitra S.K ADMIN

Posted on August 01 2025 By Mitra S.K ADMIN

Posted on July 25 2025 By Mitra S.K ADMIN

Posted on July 18 2025 By Mitra S.K ADMIN

Posted on July 01 2025 By Mitra S.K ADMIN

Posted on May 22 2025 By Mitra S.K ADMIN

Posted on January 24 2025 By Mitra S.K ADMIN

Posted on January 24 2025 By Mitra S.K ADMIN
Posted on December 31 2024 By Mitra S.K ADMIN
Posted on December 31 2024 By Mitra S.K ADMIN
Posted on December 31 2024 By Mitra S.K ADMIN
Posted on December 31 2024 By Mitra S.K ADMIN

Posted on December 31 2024 By Mitra S.K ADMIN
Posted on December 03 2024 By Mitra S.K ADMIN

Posted on October 17 2024 By Mitra S.K ADMIN

Posted on October 04 2024 By Mitra S.K ADMIN
Posted on September 13 2024 By Mitra S.K ADMIN

Posted on August 27 2024 By Mitra S.K ADMIN

Posted on August 23 2024 By Mitra S.K ADMIN

Posted on June 27 2024 By Mitra S.K ADMIN

Posted on June 22 2024 By Mitra S.K ADMIN

Posted on June 15 2024 By Mitra S.K ADMIN

Posted on May 24 2024 By Mitra S.K ADMIN
Posted on May 17 2024 By Mitra S.K ADMIN
Posted on May 09 2024 By Mitra S.K ADMIN
Posted on April 20 2024 By Mitra S.K ADMIN
Posted on April 13 2024 By Mitra S.K ADMIN

Posted on April 30 2024 By Mitra S.K ADMIN

Posted on April 29 2024 By Mitra S.K ADMIN
Posted on December 30 2023 By Mitra S.K ADMIN
Posted on December 30 2023 By Mitra S.K ADMIN
Posted on December 30 2023 By Mitra S.K ADMIN
Posted on December 27 2023 By Mitra S.K ADMIN
Posted on December 27 2023 By Mitra S.K ADMIN
Posted on December 27 2023 By Mitra S.K ADMIN
Posted on December 27 2023 By Mitra S.K ADMIN
Posted on December 27 2023 By Mitra S.K ADMIN
Posted on December 27 2023 By Mitra S.K ADMIN
Posted on December 27 2023 By Mitra S.K ADMIN
Posted on December 26 2023 By Mitra S.K ADMIN
Posted on April 05 2022 By Mitra S.K ADMIN
Posted on April 06 2022 By Mitra S.K ADMIN
Posted on April 06 2022 By Mitra S.K ADMIN
Posted on April 06 2022 By Mitra S.K ADMIN
Posted on April 06 2022 By Mitra S.K ADMIN
Posted on April 06 2022 By Mitra S.K ADMIN
Posted on April 06 2022 By Mitra S.K ADMIN
Posted on April 06 2022 By Mitra S.K ADMIN
Posted on April 06 2022 By Mitra S.K ADMIN
Posted on April 06 2022 By Mitra S.K ADMIN
Posted on April 06 2022 By Mitra S.K ADMIN

Posted on April 06 2022 By Mitra S.K ADMIN
Posted on April 06 2022 By Mitra S.K ADMIN
Posted on November 28 2022 By Mitra S.K ADMIN
Posted on April 06 2022 By Mitra S.K ADMIN
Posted on April 06 2022 By Mitra S.K ADMIN
Posted on April 06 2022 By Mitra S.K ADMIN
Posted on November 28 2022 By Mitra S.K ADMIN
Posted on June 14 2022 By Mitra S.K ADMIN

