
INTRODUCTION
Acrylic acid vapours is primarily confined to production processes because most acrylic acid is used as a precursor in the production of a variety of different acrylates. The alkyl esters of acrylic acid are used to produce a number of products including acrylic fibers, emulsion and solution polymers, and surface coatings. Some of the free acid is used to produce polyacrylic acid, which has industrial uses as a thickener, flocculants, and binder
Acrylic acid is a polar acidic compound. It is adsorbed on silica packed in silica tube through hydrogen bond. Due to its higher surface area it is an effective sampling media for adsorption of low molecular weight, polar substances.
A known volume of Acrylic acid vapours withdrawn through two silica gel tubes connected in series. Samples are desorbed in methanol-water (1:1) and analysed by high performance liquid chromatography (HPLC) using an ultraviolet (UV) detector.
Sampling Procedure
Apparatus
Glass tubes of 5 to 10-cm length with a 4-mm i.d. and a 6-mm o.d. length 70 mm are packed with 75 mg front and 150 mg back section of 20-40 mesh size
2. Sampling Technique
Connect two small sampling tubes in series using a small, red plastic cap with the end removed to join the two tubes together. Label each tube in order to distinguish the front and back tubes. Use a portion of tube to attach the sampling tubes to the pump and then attach the sampling device to the process emission out let . Turn on the personal pump and begin to record the total sampling time. Discontinue sampling at the appropriate time.
After sampling for the appropriate time, disconnect the sampling tubes from the pump and seal them with plastic end caps. we used two silica cartridge in a series. For assurance of full sampling efficiency. Here humidity and temperature plays a crucial role in retention of acrylic acid adsorption on silica. For humidity control we used silica gel impinge and glass tube with glass wool . To avoid the loss of analyte we desorped the cartridge in (1:1) methanol-water soon after the sampling.
Sample preparation
A dynamic desorption method was used to extract the sorbent material since considerable difficulty was encountered in quantitatively transferring the silica gel tubes to a small vial for solvent desorption. This is accomplished by first attaching the sampling tube to the end of a 10-mL vertically-mounted glass syringe using a small section of plastic tubing. With the plunger removed, methanol/water (1:1) desorption solution is added to the top of the syringe and the eluting solvent is collected in a 5-mL volumetric flask. Gentle pressure can be applied to the system with the plunger in place, A second, 5-mL rinse of the sampling tube is collected, to insure a thorough desorption. The two 5-mL rinse solutions are then ready for direct analysis by HPLC.
Analysis
3.5.1. HPLC conditions:
|
column: |
25-cm × 4.6-mm i.d. stainless steel column packed with Zorbax 8-Fm ODS-bound, spherical, silica particles |
|
mobile phase: |
96:4 (v/v) water/acetonitrile containing 0.1% by volume phosphoric acid. |
|
flow rate: |
1 mL/min |
|
UV detector: |
210 nm |
|
injection volume: |
25 µL |
Standard preparation:
Stock standards of acrylic acid are weighed in volumetric flasks and diluted to volume with methanol/water (1:1) to give a solution of approximately 1000 mg/L concentration.
Calibration curve preparation:
Appropriate dilutions of the stock standard in methanol/water (1:1) are made to give working standards in the 10 to 300 µg/mL range
|
Standard Curve of Acrylic Acid |
||
|
SL NO. |
Conc. (μg/ml) |
Area (mAU) |
|
STD -1 |
10 |
1978 |
|
STD-2 |
50 |
9380 |
|
STD -3 |
100 |
18124 |
|
STD-4 |
300 |
50549 |
Accuracy and Precision
The average percent recovery of acrylic acid repeat analysis of sample onto silica gel tubes samples concentration was relative standard deviation 8.80 % . Repeat analysis of three samples RSD value were found within 10 % of acceptable limit
|
Description of sample |
Volume of air (m3) |
Concentration in µg/ml |
Concentration (mg/m3) |
Concentration (ppm) |
RSD % |
|
Experiment -1 |
0.015 |
154.666 |
51.56 |
17.50 |
8.80 |
|
Experiment -2 |
0.015 |
169.922 |
56.64 |
19.23 |
|
|
Experiment -3 |
0.015 |
142.549 |
47.52 |
16.13 |
Calculations
A linear least-squares fit of standard concentrations versus response is determined. The response values of the sample are used to determine the concentration from the equation.
The air concentration for a sample in mg/m3 is determined from the following formula:
|
mg/m3 = |
(µg/mL acrylic acid in sample) (5 mL desorption solution) (1 mg) (air volume in cubic meters) (1000 µg) |
The result converted to ppm at 25°C and 760 mm Hg:
ppm = (mg/m3)(24.46)/72.06
24.46 is the molar volume at 25°C and 760 mm Hg
72.06 is the formula weight for acrylic acid
Results and discussions:
|
Description of sample |
Volume of air (m3) |
Concentration in (µg/ml) |
Concentration (mg/m3) |
Concentration (ppm) |
|
Silica front Cartridge -1 |
0.015 |
273.425 |
91.14 |
30.94 |
|
Silica back Cartridge -2 |
0.015 |
0 |
NA |
NA |
|
Field Blank Cartridge |
-- |
0 |
0 |
0 |
Conclusion
The developed method was precise and accurate for determination of acrylic acid in air by HPLC. The recovery percentage was found to be within acceptable limits. This method can be used for routine analysis of acrylic acid particularly from process emission. This is of immense importance of predicting air contamination status
Contributed by: Pradip Bag & Rituparna Mukherjee


Chief Operation, FAMD, Tata Steel Limited..


Sr. General Manager,, Emirates Trading Agency L.L.C..


Mines Manager, Hindustan Zinc Limited, a Vedanta Company.


General Manager, Stevin Rock L.L.C..


Executive Vice President (Works),, DCW Limited.


AVP – Coal Quality & Sales Compliance Head,, PT Indo Tambangraya Megah Tbk (BANPU).


Laboratory Head, MMX.


Shipping Administrator, Mount Gibson Iron Limited.


Senior Director – Asia Pacific Iron Ore Sales,, Cliffs Natural Resources Pty Ltd..


Member, Compass Group (India) Pvt. Ltd.

Posted on January 16 2026 By Mitra S.K ADMIN
Read More
Posted on January 16 2026 By Mitra S.K ADMIN

Posted on January 16 2026 By Mitra S.K ADMIN

Posted on January 16 2026 By Mitra S.K ADMIN

Posted on January 16 2026 By Mitra S.K ADMIN
Posted on December 16 2025 By Mitra S.K ADMIN
Posted on December 16 2025 By Mitra S.K ADMIN
Posted on December 16 2025 By Mitra S.K ADMIN

Posted on December 11 2025 By Mitra S.K ADMIN
![Estimating Cobalt by UV-Vis Spectroscopy: The [CoCl?]²? Acetone Method](https://mitrask.com/uploads/blogs/1764834098Estimating%20Cobalt.png)
Posted on December 04 2025 By Mitra S.K ADMIN
Posted on December 04 2025 By Mitra S.K ADMIN
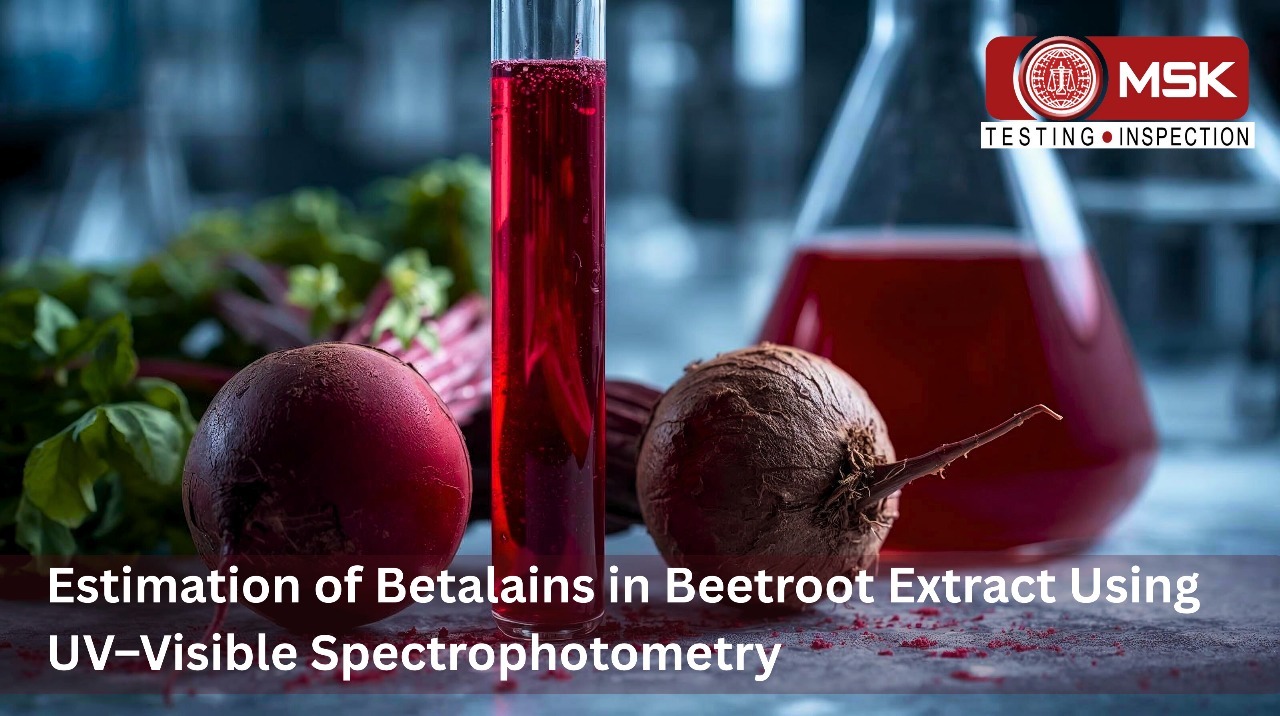
Posted on November 12 2025 By Mitra S.K ADMIN

Posted on September 23 2025 By Mitra S.K ADMIN

Posted on August 01 2025 By Mitra S.K ADMIN

Posted on July 25 2025 By Mitra S.K ADMIN

Posted on July 18 2025 By Mitra S.K ADMIN

Posted on July 01 2025 By Mitra S.K ADMIN

Posted on May 22 2025 By Mitra S.K ADMIN

Posted on January 24 2025 By Mitra S.K ADMIN

Posted on January 24 2025 By Mitra S.K ADMIN
Posted on December 31 2024 By Mitra S.K ADMIN
Posted on December 31 2024 By Mitra S.K ADMIN
Posted on December 31 2024 By Mitra S.K ADMIN
Posted on December 31 2024 By Mitra S.K ADMIN

Posted on December 31 2024 By Mitra S.K ADMIN
Posted on December 03 2024 By Mitra S.K ADMIN

Posted on October 17 2024 By Mitra S.K ADMIN

Posted on October 04 2024 By Mitra S.K ADMIN

Posted on September 13 2024 By Mitra S.K ADMIN

Posted on August 27 2024 By Mitra S.K ADMIN

Posted on August 23 2024 By Mitra S.K ADMIN

Posted on June 27 2024 By Mitra S.K ADMIN
Posted on June 22 2024 By Mitra S.K ADMIN
Posted on June 15 2024 By Mitra S.K ADMIN

Posted on May 24 2024 By Mitra S.K ADMIN

Posted on May 17 2024 By Mitra S.K ADMIN

Posted on May 09 2024 By Mitra S.K ADMIN

Posted on April 20 2024 By Mitra S.K ADMIN

Posted on April 13 2024 By Mitra S.K ADMIN

Posted on April 30 2024 By Mitra S.K ADMIN

Posted on April 29 2024 By Mitra S.K ADMIN

Posted on December 30 2023 By Mitra S.K ADMIN

Posted on December 30 2023 By Mitra S.K ADMIN

Posted on December 30 2023 By Mitra S.K ADMIN

Posted on December 27 2023 By Mitra S.K ADMIN

Posted on December 27 2023 By Mitra S.K ADMIN

Posted on December 27 2023 By Mitra S.K ADMIN

Posted on December 27 2023 By Mitra S.K ADMIN

Posted on December 27 2023 By Mitra S.K ADMIN

Posted on December 27 2023 By Mitra S.K ADMIN

Posted on December 27 2023 By Mitra S.K ADMIN

Posted on December 26 2023 By Mitra S.K ADMIN

Posted on April 05 2022 By Mitra S.K ADMIN

Posted on April 06 2022 By Mitra S.K ADMIN

Posted on April 06 2022 By Mitra S.K ADMIN

Posted on April 06 2022 By Mitra S.K ADMIN

Posted on April 06 2022 By Mitra S.K ADMIN

Posted on April 06 2022 By Mitra S.K ADMIN

Posted on April 06 2022 By Mitra S.K ADMIN

Posted on April 06 2022 By Mitra S.K ADMIN

Posted on April 06 2022 By Mitra S.K ADMIN

Posted on April 06 2022 By Mitra S.K ADMIN

Posted on April 06 2022 By Mitra S.K ADMIN

Posted on April 06 2022 By Mitra S.K ADMIN

Posted on April 06 2022 By Mitra S.K ADMIN

Posted on November 28 2022 By Mitra S.K ADMIN

Posted on April 06 2022 By Mitra S.K ADMIN

Posted on April 06 2022 By Mitra S.K ADMIN

Posted on April 06 2022 By Mitra S.K ADMIN

Posted on November 28 2022 By Mitra S.K ADMIN

Posted on June 14 2022 By Mitra S.K ADMIN

